

Authors
Ryan A. Manzuk
Dept. of Geosciences, Princeton University, Princeton, New Jersey 08544, USA, rmanzuk@princeton.edu
Devdigvijay Singh
Dept. of Geosciences, Princeton University, Princeton, New Jersey 08544, USA
Akshay Mehra
Dept. of Geosciences, Princeton University, Princeton, New Jersey 08544, USA, and Dept. of Earth Sciences, Dartmouth College, Hanover, New Hampshire 03755, USA
Emily C. Geyman
Dept. of Geosciences, Princeton University, Princeton, New Jersey 08544, USA, and Division of Geological and Planetary Sciences, California Institute of Technology, Pasadena, California 91125, USA
Stacey Edmonsond
Dept. of Geosciences, Princeton University, Princeton, New Jersey 08544, USA, and School of Earth and Ocean Sciences, University of Victoria, Victoria, British Columbia V8W 2Y2, Canada
Adam C. Maloof
Dept. of Geosciences, Princeton University, Princeton, New Jersey 08544, USA
Abstract
Accurately assessing the shape, size, and modality of features in rock samples is a longstanding problem in geology. Recent advances in machine learning have introduced the possibility of performing these tasks through automated image analysis. To leverage these methods for geological and paleontological applications, we first need a way to acquire high-resolution images of polished slabs and thin sections with a field of view large enough to fit samples containing crystals, fossils, bedforms, etc. We describe a new multispectral setup that can acquire images at ~3.76 μm per pixel spatial resolution over a 21 cm2 field of view, equipped with 8-band (470–940 nm) spectral resolution, plus a band for ultraviolet (365 nm) fluorescence. Additionally, we present a 5-band (470–940 nm) light table with automated rotating polarizers, which allows use of the camera as a high-throughput transmitted light thin section imager. The use of color bands outside the visible spectrum, as well as the registration of multiple cross-polarized rotations, encode rock properties that heighten image contrast and improve the accuracy of machine learning models. Our setup and methods provide an efficient way to (1) build reproducible image archives of rock specimens to complement field observations, (2) classify and segment those images, and (3) quantitatively compare lithofacies and fossil assemblages.
Manuscript received 21 Jan. 2022. Revised manuscript received 29 Apr. 2022. Manuscript accepted 3 May 2022. Posted 6 June 2022.
© The Geological Society of America, 2022. CC-BY-NC.
https://doi.org/10.1130/GSATG533A.1
Introduction
Geologists have developed an eye for the physical rock characteristics that encode Earth’s sedimentary, igneous, and metamorphic history. At points on a map or beds in a stratigraphic section, lithofacies observations from field campaigns form the backbone of geologic study. Throughout recent decades, the rise of geochemical techniques has increased the value of samples brought back from the field. For example, many measured sections through carbonate stratigraphies now include bed-by-bed isotope and trace element measurements that give insights into local carbon cycling (Ahm et al., 2021), global marine redox state (Dahl et al., 2019), sediment diagenesis (Ahm et al., 2018), and correlations within (Hay et al., 2019) and between basins (Halverson et al., 2005; Maloof et al., 2010). However, reliable interpretations of these geochemical data benefit from knowledge of the physical properties of the rock samples, such as grain/crystal sizes and modalities (Geyman and Maloof, 2021), primary mineralogy, porosity/permeability, and cross-cutting relationships between fabrics (Bergmann et al., 2011; Hood et al., 2016; Corsetti et al., 2006; Dyer et al., 2017)—data that also serve to refine analyses of sedimentary environment (Geyman et al., 2021). The above examples come from sedimentary geology, but the need to match geochemical data to quantitative lithofacies also applies to interpretations of igneous and metamorphic conditions (Higgins, 2000).
Workers have developed methods to approximate rock contents from samples, often by point counting on the stage of a microscope (Shand, 1916). Although this technique has brought about many geological insights, the uncertainties that stem from incompletely sampling a rock’s surface are significant (Solomon, 1963; Neilson and Brockman, 1977), and the small fields of view available in most microscopes limit the scale of features studied to those only a few millimeters in size (Higgins, 2000). To build on previous petrographic findings and contextualize geochemical data, we can develop techniques to quantify lithofacies over a broader range of feature sizes and with more continuous spatial sampling.
Imaging Setup
The imaging setup presented herein is a modification of the grinding, imaging, and reconstruction instrument (GIRI), housed at Princeton University (Mehra and Maloof, 2018). While GIRI is a specialized solution for either two- or three-dimensional imaging, a similar imaging setup could be realized independent of GIRI with widely available cameras and lights.
Field of View and Spatial Resolution
There is a trade-off between field of view (FOV) and spatial resolution, and so a camera for geological samples must balance these two variables to capture a broad size range of rock features. For many geological applications, pixels on the order of 5 μm are needed to maintain sharp grain boundaries. Most current camera attachments for petrographic or dissecting microscopes achieve this resolution or greater, but only with FOVs smaller than 1 cm2, which limits feature sizes and can add uncertainty to modality data.
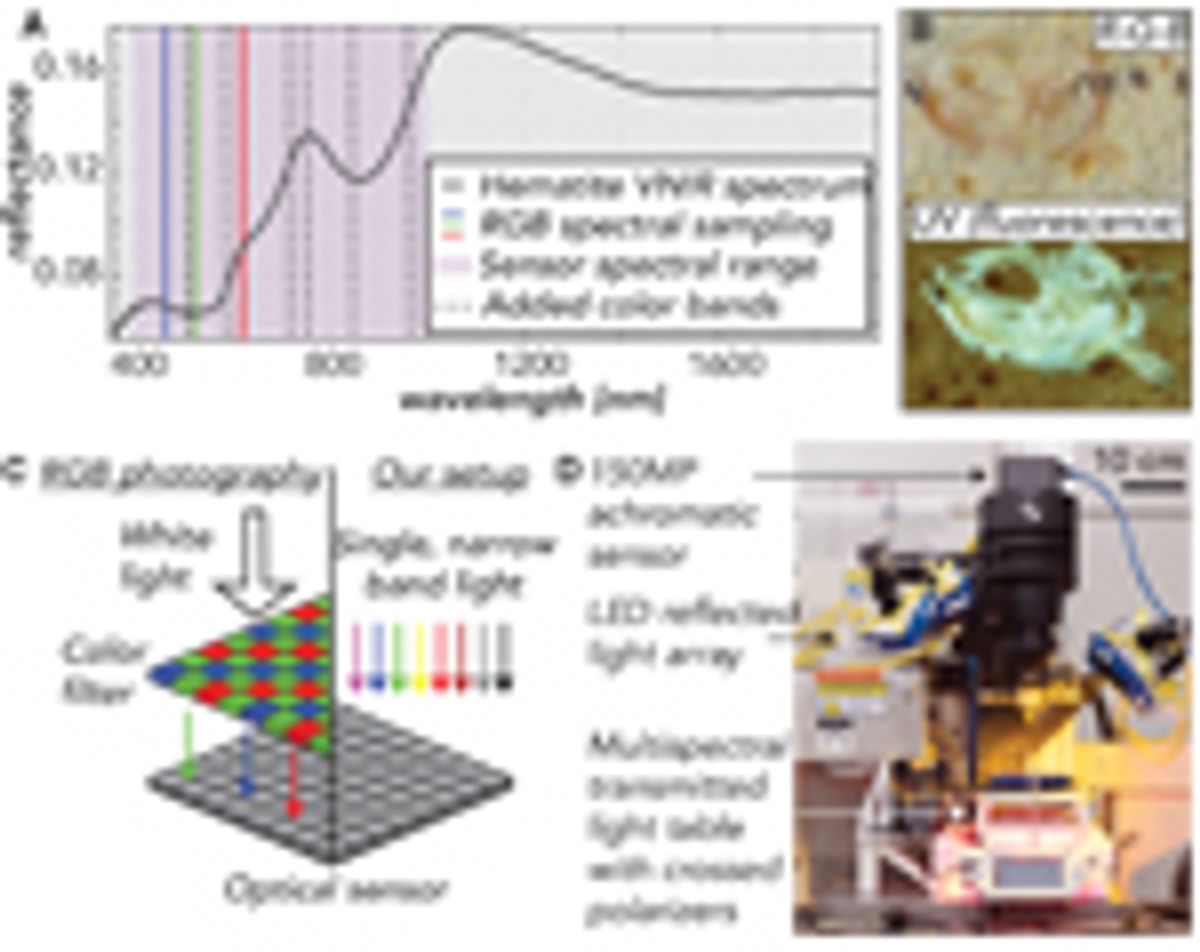
To maintain high spatial resolution while expanding FOV, we design our camera around the continually improving technologies of optical sensors and macro lenses. Our camera sensor is a Phase One IQ4 150-megapixel digital back (Fig. 1D), which measures 4.04 × 5.37 cm with 3.76 μm pixels. We use a 120 mm Schneider Kreuznach apochromatic macro lens, which enables 1:1 photography with an FOV and pixel resolution equal to the dimensions of the digital back. Other lenses can be substituted to increase FOV at the cost of per-pixel resolution. To reduce glare and improve image contrast, we place a broadband polarizer over the lens.
Spectral Resolution
One of the key lessons learned from 50 years of satellite-based remote sensing of Earth’s surface is the utility of bands outside the traditional red-green-blue (RGB) visible spectrum to take advantage of the unique reflective characteristics of rocks and vegetation (Melesse et al., 2007). The reflective properties of certain geological materials in the visible to near-infrared (VNIR; 300–1100 nm) spectrum still apply at the scale of a hand sample and can be used by a petrographic camera to maximize feature contrast and aid segmentation.
Increasing the range and number of light spectra imaged usually diminishes spatial resolution because increasingly long wavelength (>1000 nm) and/or narrowband light sources are low intensity, meaning cameras designed for hyperspectral imaging must have larger pixels to gather enough photons to form a signal. Thus, we cannot design an imager with continuous spectral coverage throughout the VNIR spectrum and instead choose to optimize for the trade-off between spatial and spectral resolution (Ma et al., 2014). Our optical sensor (sensitive from 300 to 1000 nm) maintains the highest available spatial resolutions while still detecting important spectral properties beyond RGB. In particular, metallic oxides, clay minerals, pyroxenes, and olivines have absorption bands at wavelengths less than 1000 nm that can enhance contrast between geological classes (Bishop et al., 2019; Fig. 1A).
We create color channels by illuminating samples with an array of eight Smart Vision S75 narrowband LEDs (Fig. 1D), which can be chosen from any of the ten wavelengths shown in Figure 1A. We inform our selection of lights through preliminary tests for maximized feature contrast and equip all lights with a polarizing film to reduce glare.
Ultraviolet (UV) Fluorescence
In a dark laboratory setting, fluorescence from minerals like carbonates and phosphates can add contrast when imaged in the visible spectrum. For example, in carbonate rocks at successive stages of calcite precipitation, diagenesis, and recrystallization, differences in the trace element chemistry of the stages will produce heterogeneities in the strength of fluorescence and thus contrast in the image (Dravis and Yurewicz, 1985). Additionally, organic or apatitic fossil materials often fluoresce, making UV fluorescence photography a valuable tool for creating contrast in paleontological samples (Tischlinger and Arratia, 2013; Fig. 1B). To image fluorescence, we illuminate samples with a 365 nm SmartVision LED. To reduce noise in the images, we place a bandpass filter with a cut-off wavelength of 395 nm over the UV light to remove any visible components of the emitted spectrum and use a 400 nm cut-on UV filter in front of the lens to eliminate any UV light from reaching the camera sensor. Note that when imaging with UV, the camera records the fluorescence of the materials in the VNIR spectrum.
Transmitted Light
Thin section transmitted light imagery offers another opportunity for increased contrast. Anisotropy, cleavage, and twinning create distinctive qualities in grains and crystals within a thin section and delineate grain boundaries (Rogers and Kerr, 1942). Additionally, crossed polarizers in transmitted light setups heighten contrast between features by creating differential extinction and birefringence patterns (Rogers and Kerr, 1942). To image thin sections with transmitted plane-polarized (PPL) and cross-polarized (XPL) light, we have created a light table that can be used with GIRI or any camera stand setup (Fig. 1D). The light source for this table is a dense Ramona Optics LED board with five wavelengths (470, 530, 620, 850, 940 nm), which illuminates the sample through a diffuser and a broadband linear polarizer. To image XPL, we attach a second polarizer over the sample, perpendicular to the lower linear polarizer (Fig. 1D). Unlike traditional petrographic microscopes, this light table holds the sample fixed, while a NEMA 17 stepper motor rotates both polarizers synchronously (Fueten, 1997) with a precision of 2.8 × 10⁻⁴ degrees.
Data Processing
In the case of both transmitted and reflected light, all captured image channels are perfectly aligned, allowing the user to view any three channels in a false color image or analyze all captures as a single multichannel image. Our setup, like all cameras, contends with chromatic aberration, whereby each wavelength of light achieves maximal sharpness at a different focal depth due to the wavelength-dependence of light refraction (Jacobson et al., 2013). In the supplemental material1, we demonstrate how we apply blur modeling and deconvolution to achieve multispectral images that are sharper than a standard RGB camera.
-------
1Supplemental Material. This supplement is intended to show our multispectral setup in more detail and explain how we mitigate chromatic aberration. We include a figure with annotated computer-aided design renderings of our transmitted and reflected light setups, and details for our light emission spectra. The text begins with background on the problem of chromatic aberration, details our experimental setup and blur modeling calculations, and discusses our final results. Go to https://doi.org/10.1130/GSAT.S.19773532 to access the supplemental material; contact editing@geosociety.org with any questions.
Results
In the following case studies, we illustrate two examples where the added spectral data from our reflected and transmitted light setups enhance our ability to distinguish features within geological samples. To classify pixels, we use a support vector machine (SVM), which is a simple machine learning model, to show the potential for future machine learning efforts when trained on these more informative spectral data.
Case Study 1: Feature Mapping in Reflected Light
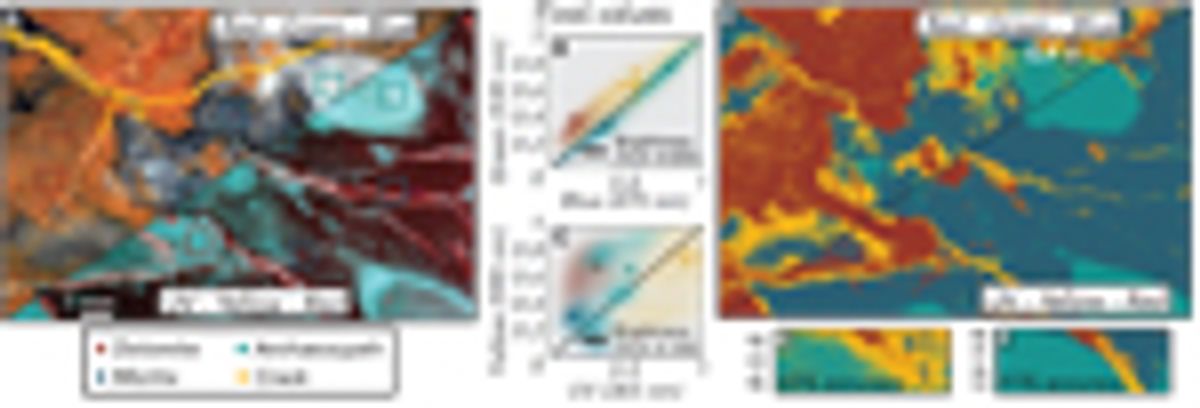
A lack of contrast between classes in reflected light imagery commonly stems from all pixel values falling near a brightness line—a 1:1 intensity line where values are well-correlated between channels (Fig. 2B). In Figure 2A, we show an RGB image of an archaeocyathid boundstone sample, wherein each of the four classes (dolomite, micritic calcite, archaeocyathid, and calcite-filled crack) shows well-correlated pixel values (Fig. 2B). When segmenting these samples, the class overlap in RGB space hinders pixel-wise classification, leading to uncertain boundaries between classes (Figs. 2D and 2E). The same image in a UV-yellow-red colorspace (Fig. 2A) shows reduced channel covariance for all four classes (Fig. 2C). With the new spectral information available in UV-yellow-red space, an SVM has 30% improved accuracy, and produces resolved regions with distinct boundaries for each class (Figs. 2D and 2F).
Case Study 2: Feature Mapping in Transmitted Light
A primary limitation of performing image analysis on thin sections with existing microscope cameras is the FOV. In this example, we use a granite sample from the Golden Horn Batholith (Eddy et al., 2016) that has crystals with diameters approaching 1 cm. Because these crystals are large relative to a microscope FOV (Fig. 3A), the concentration of minerals in an image will be variable depending on the portion of the thin section placed under the lens. For example, the concentration of plagioclase assessed through classification may range from 29% to 55% when using the 2.5× objective on a petrographic microscope (Fig. 3H). The variation in concentrations increases if magnification increases (reducing FOV) or point counts are used to assess modality as opposed to pixel classifications (Fig. 3H).
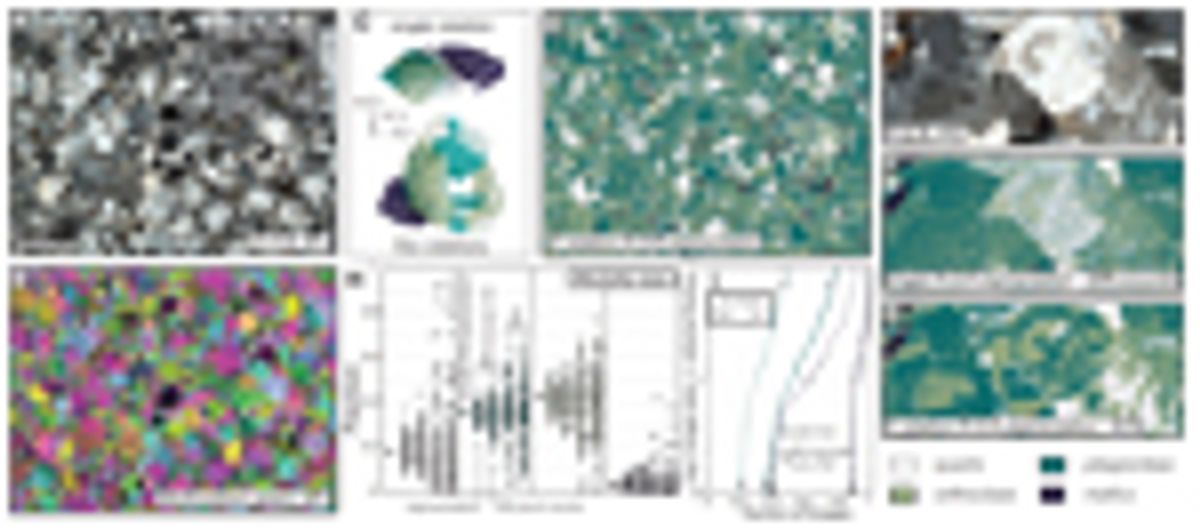
This example also illustrates the benefit of building additional image channels from polarizer orientations (as opposed to additional wavelengths of light). With a single RGB image from one orientation of the crossed polarizers, capturing all possible birefringence and extinction properties for a given mineral class in a training set can be difficult and time-consuming, and the end result can be inaccurate classification (Fig. 3F). When multiple rotation XPL images are stacked together in the training set, each pixel takes on a broader range of the color and textural properties that a mineral may exhibit in cross-polarized light, which helps the machine learning model generalize and leads to more accurate classifications with the same number of training samples (Figs. 3C, 3D, and 3G).
Discussion
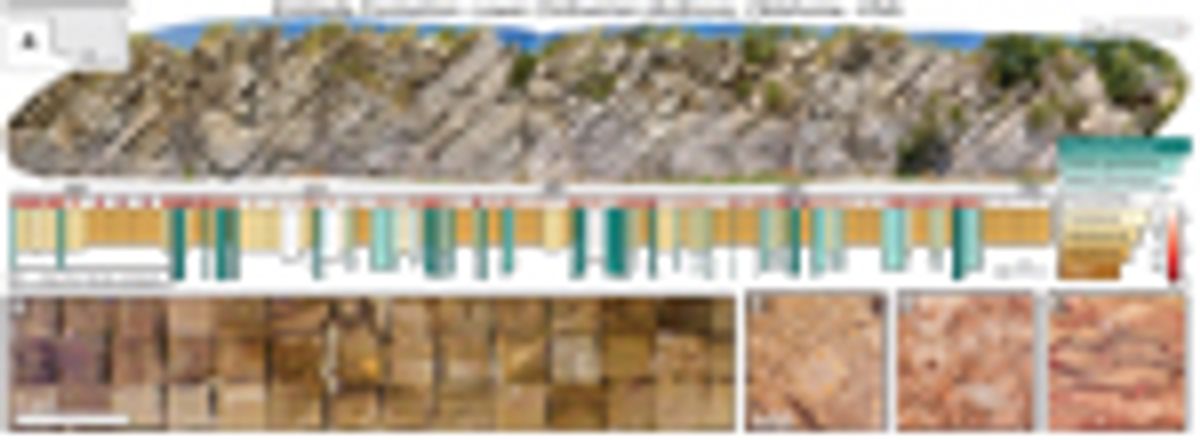
Because our camera improves outcomes when using machine learning techniques to produce petrographic data, we now are focused on high-throughput methods for complete sample image analyses within stratigraphic sections or geologic maps. Our workflow takes the same samples gathered for geochemical or geophysical laboratory analyses and photographs them as polished slabs and/or thin sections. As an example, we created a bed-by-bed library containing nearly 2,000 images that chronicles paleoenvironmental change through the lower Ordovician Kinblade Formation (Fig. 4). Within a single map or section, systematic image analysis can yield lithofacies data that quantify spatio-temporal patterns in grain, crystal, and fossil characteristics, while allowing new tests of geochemical interpretations (e.g., Geyman and Maloof, 2021; Ahm et al., 2019).
At the same time, amassing a standardized, multispectral image library with annotated examples (Deng et al., 2009) of geologic features from many localities will help train more general machine learning models for petrography. These collections of slab and thin-section images are a first step toward the goal of automated routines to measure features in rock samples from pictures. Curated image libraries also can serve as a classroom tool for teaching petrography, and student work to classify images can provide training examples for machine learning—a crowdsourcing technique that has seen recent success in several fields (e.g., van den Bergh et al., 2021).
In addition to improving lithofacies data, we see our camera and petrographic images as a vehicle to improve access and reproducibility in geology. Open access to archives like Integrated Ocean Drilling Program (IODP) cores has expanded the number of people producing complementary data sets and provided for deeper, more reproducible studies of Earth’s climate and oceans in recent geologic periods (Becker et al., 2019). A similar framework should exist for rock outcrops that span deeper into Earth’s history, where, currently, the observations that form geologic maps and stratigraphic sections tend to be documented primarily in field notes or illustrative outcrop/sample photographs. For corroboration or expansion upon previous outcrop-based studies, this system requires workers to visit the locality themselves. Instead, open access to standardized petrographic image collections will allow broader groups of researchers to measure and interpret features in rock formations from around the world, enhancing both reproducibility (Baker, 2016) and diversity, equity, and inclusion (Fernandes et al., 2020) in geology. Although our archives are not continuous records like IODP cores, they benefit from the added spatial context available at rock outcrops and provide a zoomed-in perspective to supplement constantly improving aerial survey techniques (Shah et al., 2021). In concert with satellite, drone-derived, and hand-held imagery, our pipeline for systematic imaging, classification, and measurement of rock samples can form an important layer in multiscale digitization and interpretation of physical rock properties.
Acknowledgments
The authors would like to thank NSF EAR-1028768 and Princeton University for funding. Arnab Chatterjee and Peter Siegel at Digital Transitions, Nolan Greve and Jeremy Brodersen at SmartVision Lights, Mark Harfouche and Gregor Horstmeyer at Ramona Optics, and Dave Crawford and Jenifer Powell at Moxtek provided support with the camera, lights, light table, and polarizers, respectively. We thank Bolton Howes, Cedric Hagen, Brad Samuels, and Michael Eddy for useful discussions. We also appreciate the constructive feedback received from reviewer Sarah Jacquet and editor James Schmitt.
References
- Ahm, A.S.C., Bjerrum, C.J., Blättler, C.L., Swart, P.K., and Higgins, J.A., 2018, Quantifying early marine diagenesis in shallow-water carbonate sediments: Geochimica et Cosmochimica Acta, v. 236, p. 140–159, https://doi.org/10.1016/j.gca.2018.02.042.
- Ahm, A.S.C., Maloof, A.C., Macdonald, F.A., Hoffman, P.F., Bjerrum, C.J., Bold, U., Rose, C.V., Strauss, J.V., and Higgins, J.A., 2019, An early diagenetic deglacial origin for basal Ediacaran “cap dolostones”: Earth and Planetary Science Letters, v. 506, p. 292–307, https://doi.org/10.1016/j.epsl.2018.10.046.
- Ahm, A.S.C., Bjerrum, C.J., Hoffman, P.F., Macdonald, F.A., Maloof, A.C., Rose, C.V., Strauss, J.V., and Higgins, J.A., 2021, The Ca and Mg isotope record of the Cryogenian Trezona carbon isotope excursion: Earth and Planetary Science Letters, v. 568, 117002, https://doi.org/10.1016/j.epsl.2021.117002.
- Baker, M., 2016, Reproducibility crisis: Nature, v. 533, p. 353–366.
- Becker, K., Austin, J.A., Exon, N., Humphris, S., Kastner, M., McKenzie, J.A., Miller, K.G., Suyehiro, K., and Taira, A., 2019, 50 Years of Scientific Ocean Drilling: Oceanography (Washington, D.C.), v. 32, p. 17–21, https://doi.org/10.5670/oceanog.2019.110.
- Bergmann, K.D., Zentmyer, R.A., and Fischer, W.W., 2011, The stratigraphic expression of a large negative carbon isotope excursion from the Ediacaran Johnnie Formation, Death Valley: Precambrian Research, v. 188, p. 45–56, https://doi.org/10.1016/j.precamres.2011.03.014.
- Bishop, J.L., Bell, J.F., III, and Moersch, J.E., editors, 2019, Remote Compositional Analysis: Techniques for Understanding Spectroscopy, Mineralogy, and Geochemistry of Planetary Surfaces. Volume 24: Cambridge, UK, Cambridge University Press, https://doi.org/10.1017/9781316888872.
- Cesare, B., Campomenosi, N., and Shribak, M., 2022, Polychromatic polarization: Boosting the capabilities of the good old petrographic microscope: Geology, v. 50, p. 137–141, https://doi.org/10.1130/G49303.1.
- Corsetti, F.A., Kidder, D.L., and Marenco, P.J., 2006, Trends in oolite dolomitization across the Neoproterozoic-Cambrian boundary: A case study from Death Valley, California: Sedimentary Geology, v. 191, p. 135–150, https://doi.org/10.1016/j.sedgeo.2006.03.021.
- Dahl, T.W., Connelly, J.N., Li, D., Kouchinsky, A., Gill, B.C., Porter, S., Maloof, A.C., and Bizzarro, M., 2019, Atmosphere-ocean oxygen and productivity dynamics during early animal radiations: Proceedings of the National Academy of Sciences of the United States of America, v. 116, p. 19,352–19,361, https://doi.org/10.1073/pnas.1901178116.
- Deng, J., Dong, W., Socher, R., Li, L.J., Li, K., and Fei-Fei, L., 2009, Imagenet: A large-scale hierarchical image database: 2009 IEEE Conference on Computer Vision and Pattern Recognition: IEEE, p. 248–255, https://10.1109/CVPR.2009.5206848.
- Dravis, J.J., and Yurewicz, D.A., 1985, Enhanced carbonate petrography using fluorescence microscopy: Journal of Sedimentary Research, v. 55, p. 795–804.
- Dyer, B., Higgins, J.A., and Maloof, A.C., 2017, A probabilistic analysis of meteorically altered δ13C chemostratigraphy from late Paleozoic ice age carbonate platforms: Geology, v. 45, p. 135–138, https://doi.org/10.1130/G38513.1.
- Eddy, M.P., Bowring, S.A., Miller, R.B., and Tepper, J.H., 2016, Rapid assembly and crystallization of a fossil large-volume silicic magma chamber: Geology, v. 44, p. 331–334, https://doi.org/10.1130/G37631.1.
- Fernandes, A.M., Abeyta, A., Mahon, R.C., Martindale, R., Bergmann, K.D., Jackson, C., Present, T.M., Swanson, T., Reano, D., Butler, K., Swanson, T., Butler, K., Brisson, S., Johnson, C., Mohrig, D., and Blum, M.D., 2020, “Enriching Lives within Sedimentary Geology”: Actionable Recommendations for Making SEPM a Diverse, Equitable and Inclusive Society for All Sedimentary Geologists: EarthArXiv, https://doi.org/10.31223/osf.io/y7v9e.
- Fueten, F., 1997, A computer-controlled rotating polarizer stage for the petrographic microscope: Computers & Geosciences, v. 23, p. 203–208, https://doi.org/10.1016/S0098-3004(97)85443-X.
- Geyman, E.C., and Maloof, A.C., 2021, Facies control on carbonate δ13C on the Great Bahama Bank: Geology, v. 49, p. 1049–1054, https://doi.org/10.1130/G48862.1.
- Geyman, E.C., Maloof, A.C., and Dyer, B., 2021, How is sea level change encoded in carbonate stratigraphy?: Earth and Planetary Science Letters, v. 560, 116790, https://doi.org/10.1016/j.epsl.2021.116790.
- Halverson, G.P., Hoffman, P.F., Schrag, D.P., Maloof, A.C., and Rice, A.H.N., 2005, Toward a Neoproterozoic composite carbon-isotope record: Geological Society of America Bulletin, v. 117, p. 1181–1207, https://doi.org/10.1130/B25630.1.
- Hay, C.C., Creveling, J.R., Hagen, C.J., Maloof, A.C., and Huybers, P., 2019, A library of early Cambrian chemostratigraphic correlations from a reproducible algorithm: Geology, v. 47, p. 457–460, https://doi.org/10.1130/G46019.1.
- He, K., Gkioxari, G., Dollár, P., and Girshick, R., 2017, Mask R-CNN: Proceedings of the 2017 IEEE International Conference on Computer Vision, p. 2961–2969, https://10.1109/ICCV.2017.322.
- Higgins, M.D., 2000, Measurement of crystal size distributions: The American Mineralogist, v. 85, p. 1105–1116, https://doi.org/10.2138/am-2000-8-901.
- Hood, A.v., Planavsky, N.J., Wallace, M.W., Wang, X., Bellefroid, E.J., Gueguen, B., and Cole, D.B., 2016, Integrated geochemical-petrographic insights from component-selective 238U of Cryogenian marine carbonates: Geology, v. 44, p. 935–938, https://doi.org/10.1130/G38533.1.
- Jacobson, R., Ray, S., Attridge, G.G., and Axford, N., 2013, Manual of Photography: New York, Routledge, 464 p., https://doi.org/10.4324/9780080510965.
- Koeshidayatullah, A., Morsilli, M., Lehrmann, D.J., Al-Ramadan, K., and Payne, J.L., 2020, Fully automated carbonate petrography using deep convolutional neural networks: Marine and Petroleum Geology, v. 122, 104687, https://doi.org/10.1016/j.marpetgeo.2020.104687.
- LeCun, Y., Boser, B., Denker, J., Henderson, D., Howard, R., Hubbard, W., and Jackel, L., 1989, Handwritten digit recognition with a back-propagation network: Advances in Neural Information Processing Systems, v. , p. 396–404.
- Li, X., Chen, H., Qi, X., Dou, Q., Fu, C.W., and Heng, P.A., 2018, H-DenseUNet: Hybrid densely connected UNet for liver and tumor segmentation from CT volumes: IEEE Transactions on Medical Imaging, v. 37, p. 2663–2674, https://doi.org/10.1109/TMI.2018.2845918.
- Lin, T.Y., Maire, M., Belongie, S., Hays, J., Perona, P., Ramanan, D., Dollár, P., and Zitnick, C.L., 2014, Microsoft COCO: Common objects in context, in Fleet, D., Pajdla, T., Schiele, B., and Tuytelaars, T., eds., Computer Vision—ECCV 2014: Lecture Notes in Computer Science: Berlin, Springer, v. 8693, p. 740–755, https://doi.org/10.1007/978-3-319-10602-1_48.
- Ma, C., Cao, X., Tong, X., Dai, Q., and Lin, S., 2014, Acquisition of high spatial and spectral resolution video with a hybrid camera system: International Journal of Computer Vision, v. 110, p. 141–155, https://doi.org/10.1007/s11263-013-0690-4.
- Maloof, A.C., Porter, S.M., Moore, J.L., Dudás, F.Ö., Bowring, S.A., Higgins, J.A., Fike, D.A., and Eddy, M.P., 2010, The earliest Cambrian record of animals and ocean geochemical change: Geological Society of America Bulletin, v. 122, p. 1731–1774, https://doi.org/10.1130/B30346.1.
- Mehra, A., and Maloof, A., 2018, Multiscale approach reveals that Cloudina aggregates are detritus and not in situ reef constructions: Proceedings of the National Academy of Sciences, v. 15, no. 11, https://doi.org/10.1073/pnas.1719911115.
- Melesse, A.M., Weng, Q., Thenkabail, P.S., and Senay, G.B., 2007, Remote sensing sensors and applications in environmental resources mapping and modelling: Sensors (Basel), v. 7, p. 3209–3241, https://doi.org/10.3390/s7123209.
- Neilson, M., and Brockman, G., 1977, The error associated with point-counting: The American Mineralogist, v. 62, p. 1238–1244.
- Rogers, A.F., and Kerr, P.F., 1942, Optical Mineralogy: New York, McGraw-Hill.
- Shah, A.K., Morrow, R., Pace, M., Harris, M.S., and Doar, W., III, 2021, Mapping critical minerals from the sky: GSA Today, v. 31, https://doi.org/10.1130/GSATG512A.1.
- Shand, S., 1916, A recording micrometer for geometrical rock analysis: The Journal of Geology, v. 24, p. 394–404, https://doi.org/10.1086/622346.
- Solomon, M., 1963, Counting and sampling errors in modal analysis by point counter: Journal of Petrology, v. 4, p. 367–382, https://doi.org/10.1093/petrology/4.3.367.
- Soomro, T.A., Khan, M.A., Gao, J., Khan, T.M., and Paul, M., 2017, Contrast normalization steps for increased sensitivity of a retinal image segmentation method: Signal, Image and Video Processing, v. 11, p. 1509–1517, https://doi.org/10.1007/s11760-017-1114-7.
- Tian, Y., Pei, K., Jana, S., and Ray, B., 2018, Deeptest: Automated testing of deep-neural-network-driven autonomous cars: Proceedings of the 40th International Conference on Software Engineering, p. 303–314, https://doi.org/10.1145/3180155.3180220.
- Tischlinger, H., and Arratia, G., 2013, Ultraviolet light as a tool for investigating Mesozoic fishes, with a focus on the ichthyofauna of the Solnhofen archipelago, in Arratia, G., Schultze, H.-P., and Wilson, M.V.H., eds., Mesozoic Fishes 5—Global Diversity and Evolution: München, Germany, Verlag Dr. Friedrich Pfeil, p. 549–560.
- van den Bergh, J., Chirayath, V., Li, A., Torres-Perez, J.L., and Segal-Rozenhaimer, M., 2021, NeMO-Net—Gamifying 3D labeling of multi-modal reference datasets to support automated marine habitat mapping: Frontiers in Marine Science, v. 8, p. 347, https://doi.org/10.3389/fmars.2021.645408.
- Yesiloglu-Gultekin, N., Keceli, A.S., Sezer, E.A., Can, A.B., Gokceoglu, C., and Bayhan, H., 2012, A computer program (TSecSoft) to determine mineral percentages using photographs obtained from thin sections: Computers & Geosciences, v. 46, p. 310–316, https://doi.org/10.1016/j.cageo.2012.01.001.


